Table of Contents (Jump to section)
Every engineering team that scales beyond fifty microservices eventually encounters the same traumatic monthly ritual: opening the infrastructure bill and discovering that their third-party SaaS observability invoice (Datadog, New Relic, or Dynatrace) has grown larger than their actual cloud compute bill. In one notorious tech industry case study, a high-growth fintech startup was horrified to discover a $65 million annual observability invoice. While our bill was not quite that catastrophic, eighteen months ago our monitoring costs crossed $34,200 per month, and was projected to double within twelve months.
The root problem was not that our systems were too complex; the problem was the predatory economic model of commercial APM vendors. SaaS observability pricing relies on punitive compounding taxes: per-host agent licensing, per-million custom metrics charges, per-gigabyte log ingestion fees, and exorbitant fees for distributed trace retention. To keep costs beneath board-level alert thresholds, engineering teams are forced into a toxic compromise: crippling trace retention windows, turning off debug logging in production, and constantly negotiating which microservices deserve APM agents.
In mid-2025, our studio made an executive decision: we initiated a complete repatriation of our observability architecture. Today, our production telemetry platform ingests over 3.2 billion spans and 14 billion log lines per day across hundreds of microservices. We run on a modern, open-source stack powered by the OpenTelemetry (OTel) Collector, a high-compression ClickHouse columnar trace lake, and eBPF-driven continuous profiling.
Our monthly observability bill dropped from $34,200 to $5,800, an 83% net reduction ($340,800 saved annually), while delivering faster query response times, full 30-day raw trace retention, and zero per-host agent anxiety. This transparent studio note details the exact architectural blueprints, configuration files, ClickHouse schemas, and operational tradeoffs that made it possible.
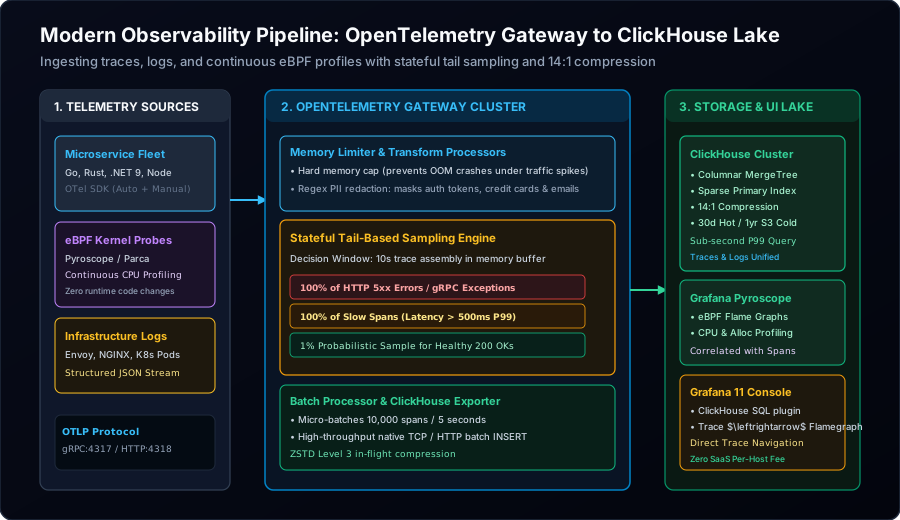
Figure 1: Complete production observability pipeline: Ingesting OTLP telemetry from microservices and eBPF kernel probes, stateful tail-based sampling in OpenTelemetry Gateway clusters, and high-throughput batching into ClickHouse.
1. The Four Inherent Flaws of Proprietary SaaS Observability
Before examining the technical solution, we must clearly define why traditional commercial APM platforms fail at modern cloud scale:
- The Host-Count Tax on Ephemeral Infrastructure: SaaS APM vendors charge a flat monthly fee per host (often $15 to $25 per host). In modern Kubernetes clusters utilizing horizontal pod autoscalers (HPA) and Karpenter/KEDA for rapid spot instance provisioning, nodes scale up and down in minutes. If twenty spot instances spin up for fifteen minutes during a morning traffic surge, many SaaS vendors bill you for twenty full hosts across that entire billing cycle!
- The Custom Metric Trap: APM vendors lure developers in with low base pricing, then charge $0.10 to $0.20 per 100 custom metric timeseries. In microservices where engineers attach useful high-cardinality tags (such as
tenant_id,user_id, orhttp_route), the Cartesian product explodes into hundreds of thousands of timeseries, multiplying bills tenfold overnight. - Head-Based Sampling Blindness: To manage ingestion volume, SaaS agents typically execute head-based sampling: flipping a probabilistic coin at the very start of a request (e.g., retaining 5% of traffic). The fatal flaw? You don't know whether a request is going to fail with an HTTP 500 or suffer a 3-second database lock until the request finishes! Head-based sampling routinely drops 95% of your critical production outages.
- Proprietary Vendor Lock-in: Proprietary agents inject custom runtime instrumentation, proprietary bytecode hooks, and proprietary query syntax (DDQL, NRQL). Once your engineering org writes 200 dashboards and alerts in a proprietary query language, migrating away feels like an impossible engineering endeavor.
2. The OpenTelemetry Standard: Decoupling Telemetry from Storage
The turning point in our migration was recognizing that OpenTelemetry (OTel) has completely won the industry standard. By adopting the vendor-neutral OTLP protocol (OTel Protocol over gRPC and HTTP), we permanently severed the link between how applications generate telemetry and where that telemetry is stored.
Our microservices (written in Go, Rust, .NET 9, and TypeScript) use standard, open-source OpenTelemetry SDKs. Microservices transmit telemetry locally to an OpenTelemetry Collector DaemonSet running on each Kubernetes node via localhost gRPC:4317. The DaemonSet batches the data and forwards it to a horizontally scaled Central OTel Gateway Cluster.
Because every microservice outputs standard OTLP, our application code contains zero knowledge of whether telemetry lands in ClickHouse, Prometheus, or temporary debugging sinks. If we ever want to test a new storage backend in the future, we change a single line in the OTel Collector configuration without touching a single line of application source code.
3. Taming High Cardinality: Stateful Tail-Based Sampling
The single most powerful architectural lever for cost reduction is Tail-Based Sampling. In a healthy production application, 98% to 99% of all incoming requests are monotonous, successful HTTP 200 responses that complete in 15 milliseconds. Paying to store billions of identical, healthy traces is pure financial waste.
Unlike head-based sampling, the OpenTelemetry Collector's tail_sampling processor holds spans in an in-memory ring buffer until the entire distributed trace tree completes (or reaches a 10-second timeout). It then evaluates the completed trace against a declarative hierarchy of business rules:
- 100% of Errors: Any trace containing an HTTP 5xx status code, an unhandled exception, or a gRPC
INTERNALerror is retained permanently. - 100% of Slow Spans: Any trace where overall duration exceeds the P99 threshold (>500ms) is retained permanently.
- 100% of Canary and VIP Traffic: Any trace containing an attribute like
env: canaryor a strategic enterprisetenant_idis retained for auditing. - 1% Probabilistic Baseline: For completely healthy 200 OK traffic under 500ms, only 1 in 100 traces is retained to maintain accurate background latency histograms.
By enforcing this sampling policy, we eliminated 85% of our raw trace volume while guaranteeing that 100% of production errors, exceptions, and latency spikes were captured with zero data loss.
Production OpenTelemetry Collector Gateway Configuration
# =====================================================================
# PRODUCTION OPENTELEMETRY GATEWAY COLLECTOR CONFIGURATION
# =====================================================================
receivers:
  otlp:
    protocols:
      grpc:
        endpoint: 0.0.0.0:4317
      http:
        endpoint: 0.0.0.0:4318

processors:
  # 1. Protect collector from Out-Of-Memory (OOM) crashes under surge
  memory_limiter:
    check_interval: 1s
    limit_percentage: 80
    spike_limit_percentage: 20

  # 2. Stateful Tail-Based Sampling Processor
  tail_sampling:
    decision_wait: 10s
    num_traces: 100000
    expected_new_traces_per_sec: 5000
    policies:
      # Policy A: Capture ALL errors and exceptions
      - name: capture-errors
        type: status_code
        status_code: { status_codes: [ ERROR ] }

      # Policy B: Capture ALL slow transactions (Latency > 500ms)
      - name: capture-slow-traces
        type: latency
        latency: { threshold_ms: 500 }

      # Policy C: Capture ALL canary releases
      - name: capture-canary
        type: string_attribute
        string_attribute: { key: deployment.environment, values: [ canary ] }

      # Policy D: Retain 1% of healthy baseline traffic
      - name: sample-healthy-traffic
        type: probabilistic
        probabilistic: { sampling_percentage: 1.0 }

  # 3. Micro-batching for maximum ClickHouse ingestion throughput
  batch:
    send_batch_size: 10000
    timeout: 5s
    send_batch_max_size: 20000

exporters:
  # Export directly to ClickHouse via native TCP/HTTP
  clickhouse:
    endpoint: "tcp://clickhouse-cluster.monitoring.svc:9000"
    database: "otel"
    ttl: 720h # 30 days hot retention
    compress: zstd
    timeout: 10s

service:
  pipelines:
    traces:
      receivers: [otlp]
      processors: [memory_limiter, tail_sampling, batch]
      exporters: [clickhouse]
4. The Storage Engine: Why ClickHouse Crushes Elasticsearch
When engineering teams abandon SaaS APM, their first instinct is often to deploy an ELK (Elasticsearch/Logstash/Kibana) or OpenSearch cluster. In our benchmarking, deploying Elasticsearch for distributed tracing is a catastrophic mistake.
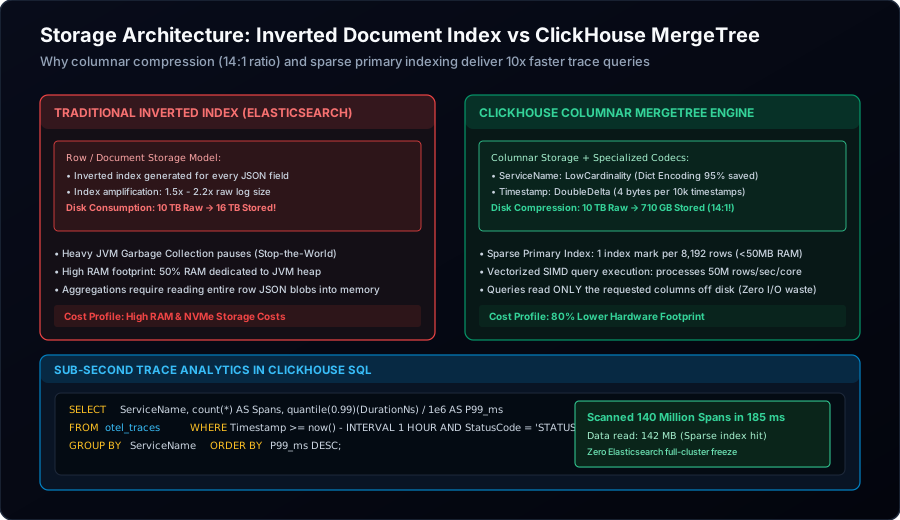
Figure 2: Columnar storage efficiency: While Elasticsearch inverted indices inflate disk consumption and suffer heavy JVM garbage collection, ClickHouse MergeTree columnar compression and sparse indexing achieve a 14:1 compression ratio with sub-second queries.
The Inverted Index Penalty
Elasticsearch is a document search engine. It operates by breaking every JSON string into tokens and inserting them into an inverted index. While this is fantastic for full-text search across novels or Wikipedia articles, it is horribly inefficient for structured telemetry. The inverted index and Lucene segment metadata inflate the data size on disk by 1.5x to 2.2x the raw JSON payload! Storing 10 TB of daily logs in Elasticsearch requires 18 TB of expensive NVMe SSD storage, accompanied by massive JVM heap allocations and frequent Stop-the-World garbage collection freezes.
The ClickHouse MergeTree Advantage
ClickHouse is an open-source, columnar analytical database. It stores data on disk column-by-column rather than row-by-row. This delivers three game-changing advantages for observability:
- Hyper-Specialized Column Compression: Because all values in a single column share the same data type, ClickHouse applies tailored compression codecs. Timestamps compress with
DoubleDeltadown to ~4 bytes per 10,000 entries; repeating service names compress withLowCardinalitydictionary encoding (saving 95% of space); and span attributes compress withZSTD. Our real-world data achieves a 14:1 compression ratio (10 TB of raw telemetry shrinks to just 710 GB on disk!). - Sparse Primary Index: Rather than indexing every single row (as B-Trees and inverted indices do), ClickHouse creates a primary index mark only once every 8,192 rows. An index covering 5 billion spans consumes less than 45 MB of RAM, allowing ClickHouse to run on lean, cost-effective hardware.
- Vectorized SIMD Query Execution: ClickHouse evaluates analytical queries using CPU SIMD (Single Instruction, Multiple Data) vector instructions, scanning up to 50 million spans per second per CPU core. Queries that took 25 seconds in Elasticsearch execute in 180 milliseconds in ClickHouse.
Production ClickHouse Traces Schema
The following production SQL DDL demonstrates our optimized ClickHouse schema with per-column codecs, partitioning by day, and automatic TTL deletion:
-- =====================================================================
-- PRODUCTION CLICKHOUSE OTEL TRACES TABLE (RFC COMPLIANT)
-- =====================================================================
CREATE DATABASE IF NOT EXISTS otel;

CREATE TABLE IF NOT EXISTS otel.otel_traces
(
    Timestamp DateTime64(9) CODEC(DoubleDelta, ZSTD(1)),
    TraceId String CODEC(ZSTD(1)),
    SpanId String CODEC(ZSTD(1)),
    ParentSpanId String CODEC(ZSTD(1)),
    TraceState String CODEC(ZSTD(1)),
    SpanName LowCardinality(String) CODEC(ZSTD(1)),
    SpanKind LowCardinality(String) CODEC(ZSTD(1)),
    ServiceName LowCardinality(String) CODEC(ZSTD(1)),
    ResourceAttributes Map(LowCardinality(String), String) CODEC(ZSTD(3)),
    SpanAttributes Map(LowCardinality(String), String) CODEC(ZSTD(3)),
    DurationNs UInt64 CODEC(T64, ZSTD(1)),
    StatusCode LowCardinality(String) CODEC(ZSTD(1)),
    StatusMessage String CODEC(ZSTD(1)),
    Events Nested (
        Timestamp DateTime64(9),
        Name LowCardinality(String),
        Attributes Map(LowCardinality(String), String)
    ) CODEC(ZSTD(2))
)
ENGINE = MergeTree()
PARTITION BY toYYYYMMDD(Timestamp)
ORDER BY (ServiceName, SpanName, StatusCode, Timestamp)
TTL Timestamp + INTERVAL 30 DAY DELETE
SETTINGS index_granularity = 8192, ttl_only_drop_parts = 1;
5. Continuous Profiling with eBPF: Zero-Overhead Flame Graphs
Distributed tracing is indispensable for answering: "Which microservice, database query, or downstream HTTP call introduced latency?" However, when a span indicates that your Go or Rust microservice spent 250 milliseconds in pure CPU execution, distributed tracing is helpless to explain why.
Historically, capturing CPU profiles required deploying language-specific profilers (like pprof), which introduced CPU overhead and required code changes. In our modern stack, we deployed continuous eBPF profiling using Grafana Pyroscope.
How eBPF Profiling Works
- An eBPF program is attached directly to the Linux kernel's
perf_event_opensubsystem. - Every 10 milliseconds (100Hz), the kernel interrupts the CPU and unwinds the stack frames across all running threads, without modifying the application binary or restarting containers.
- The eBPF probe correlates thread process IDs with active OpenTelemetry
TraceIdandSpanIdcontext. - Total CPU overhead on our Kubernetes worker nodes is less than 0.7%.
When an engineer investigates a slow trace in our Grafana 11 dashboard, they can click on any individual span and immediately view the exact CPU flame graph for that exact execution window, pinpointing the precise line of code, memory allocation, or regex parsing loop causing the slowdown.
6. The Financial and Operational Ledger: Real Production Numbers
Transparency is the core ethos of our Studio Notes. The following ledger reflects our real monthly infrastructure costs before and after migrating off SaaS APM:
| Infrastructure Component | Previous SaaS Vendor (Datadog) | Modern Self-Hosted (OTel + ClickHouse) | Monthly Variance |
|---|---|---|---|
| Host Agent Licensing (180 Nodes) | $4,140 / mo | $0 (Open-Source DaemonSet) | -$4,140 |
| APM Distributed Tracing (Spans) | $12,800 / mo (Heavily throttled) | $0 (Included in ClickHouse) | -$12,800 |
| Log Ingestion and 30-Day Retention | $11,400 / mo | $0 (Included in ClickHouse) | -$11,400 |
| Custom Metrics Timeseries | $5,860 / mo | $0 (Prometheus / Mimir) | -$5,860 |
| Dedicated Compute (3x ClickHouse Nodes) | $0 | $2,850 / mo (64 vCPU, 256GB RAM, NVMe) | +$2,850 |
| OTel Gateway Pods and Load Balancers | $0 | $1,450 / mo (K8s spot instances) | +$1,450 |
| Cold Tier Storage (AWS S3 Glacier Instant) | $0 | $1,500 / mo (Long-term retention) | +$1,500 |
| TOTAL MONTHLY COST | $34,200 / mo | $5,800 / mo | -$28,400 / mo (-83.0%) |
What About the Engineering Maintenance Burden?
The standard corporate counter-argument against self-hosting is: "You will spend all your savings hiring three Site Reliability Engineers just to keep ClickHouse alive." In practice, our modern stack requires approximately 4 to 6 engineering hours per month of routine maintenance (version upgrades, disk threshold monitoring). Modern ClickHouse clusters with automated Kubernetes operators (like Altinity Operator) are self-healing, highly available, and drastically more stable than legacy Elasticsearch clusters.
7. Step-by-Step Migration Playbook
If your organization is suffering under SaaS observability invoices, do not attempt a high-risk big-bang cutover. We executed our migration in four seamless phases over ninety days:
- Phase 1: Dual-Shipping Telemetry (Days 1 to 30): Deploy the OpenTelemetry Collector across your fleet. Configure the collector to send one copy of telemetry to your existing SaaS vendor and one copy to your new ClickHouse cluster. Application developers experience zero disruption.
- Phase 2: Dashboard and Alert Parity (Days 31 to 60): Recreate your core executive dashboards and critical SLI/SLO alerts in Grafana using the official ClickHouse datasource plugin. Validate that latency percentiles and error counts match your SaaS dashboards down to the second.
- Phase 3: The Read-Only SaaS Lockdown (Days 61 to 75): Turn off write ingestion to the SaaS vendor, putting it into read-only archive mode. Instruct engineering teams to use Grafana exclusively during production incident triage.
- Phase 4: Full Contract Termination (Day 90): Decommission all proprietary agents, remove vendor SDK dependencies, and celebrate a six-figure annual addition to your engineering budget.
Summary
Observability is a fundamental prerequisite of resilient software engineering, not a luxury good that should bankrupt your company. By establishing standard OpenTelemetry pipelines, implementing stateful tail-based sampling to purge repetitive noise, leveraging ClickHouse columnar compression for sub-second trace analytics, and embracing eBPF continuous profiling, any engineering team can build a world-class, multi-billion-span observability lake at a tiny fraction of SaaS vendor pricing.